Turn Energy Data into Smart Decisions with Business Intelligence Dashboard

Overview

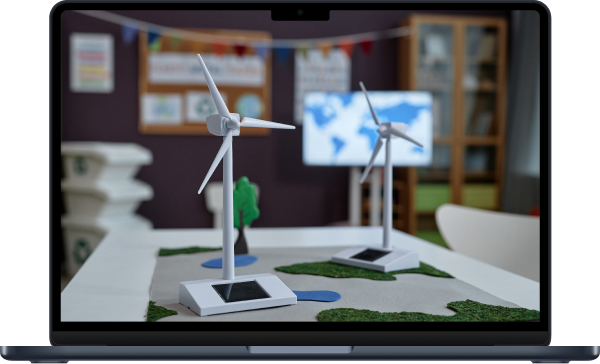
A renewable energy company wanted to manage their wind farms and solar panel plants across multiple locations. They struggled to monitor their plants and wanted to track the energy output in all their plants.
They worked with Dashboards Experts India to design a BI dashboard, which helped them to achieve their goal and help them optimize their operations.

Industry

Renewable Energy

Services

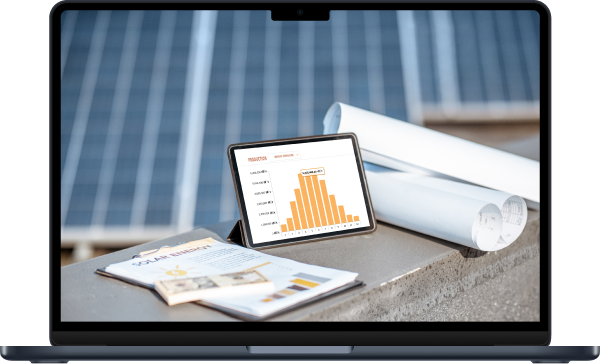
Business Analytics Dashboard

Our Process

After having an in-depth conversation with our client, we filtered out the information that needed to be presented in their BI dashboard. Our aim was to enable real time updates and present complex data in a visual format.

1
Collecting Data

We collected the data from different sources from sensors and energy management systems into a single platform.

2
Data Visualization

We consolidated all the KPIs like plat efficiency and energy out by region through graphs and pie charts.

3
Forecasting Models

Added forecasting models to know about the energy usage, based on historical data and weather reports.

4
User Friendly Interface

Made the dashboard responsive and intuitive, so that everyone could access and use the dashboard with ease.

The Problem

Our client found it difficult to analyze energy output, monitor performance, and spot operational gaps due to siloed data. This lead to uneven energy forecasting and resource management, which decreased efficiency and increased unnecessary operating expenses.

Our Role

  • Metrics Visualization
  • Usability Design
  • Energy Forecasting
  • Data Consolidation

Project Challenges

1. Disparate Data Sources

Adding the relevant data from different sources such as wind turbines and solar panels, was a time taking process.

2. Scalability

Ensuring that the dashboard could adapt after adding new devices was also a challenge for us.

Results

The business intelligence dashboard helped the client to manage their plants effectively and gain real time insights. As a result, it helped them to streamline their operations and manage their energy outputs better.

Improved Maintenance

Downtime reduced by 20%, which enhanced their overall operational efficiency.

Improved Energy Monitoring

The energy output increased by 15%, thanks to the real time tracking feature in the business intelligence dashboard.

Enhanced Decision Making

Proactive decision making allowed our client to plan energy production and allocate resources effectively.