
Building Interactive Dashboards: Everything You Need to Know
With the tons of data generated every day, there is more demand to be on toes for business. Because the dynamic business landscape is evolving at a great pace. So, to keep up with the technological advancements, enterprises must focus on upgrades. And to manage this data mindfully, a interactive dashboards is the best tool for your rescue. Above that, an interactive dashboard will help. If you want to know how let's dive in.
What is exactly an interactive dashboard?
A dynamic data visualization tool for real-time investigation is an interactive dashboard. These dashboards make data analysis an interesting process to filter or drill down data. However, it's not the same as the typical dashboards you use in your business. By filtering data for particular data, you can use it to examine regional performance. It is simpler to spot trends for well-informed decisions.How do interactive dashboards benefit B2B businesses?
Some key benefits of interactive dashboards to looking at these dashboards are: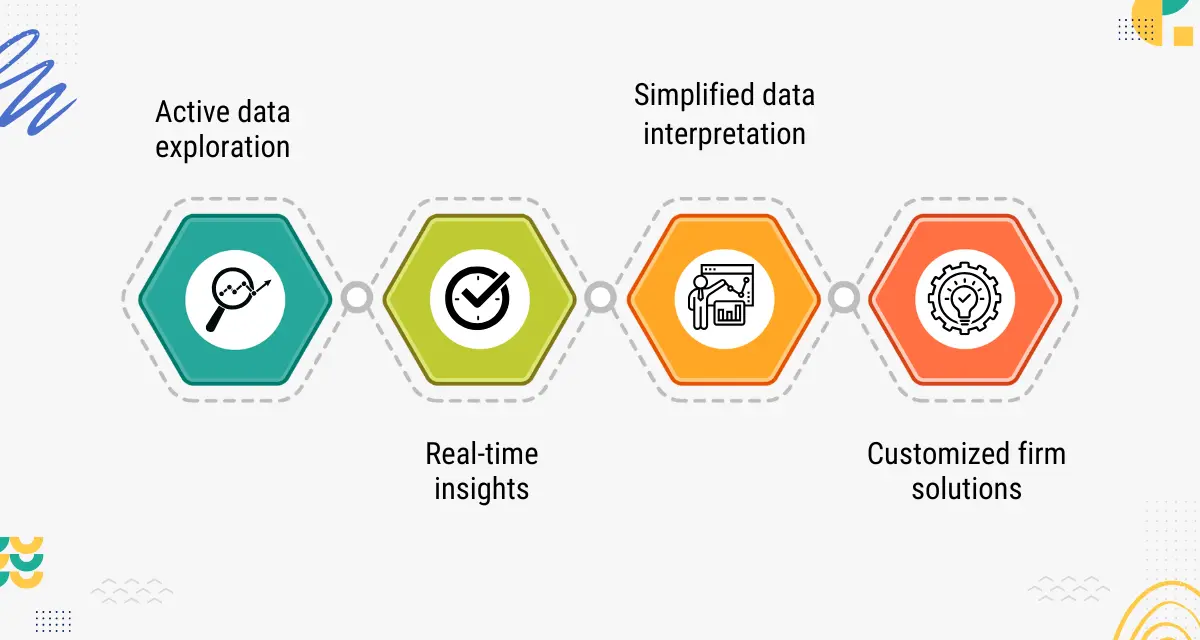
Active data exploration
Users can actively interact with the data through interactive dashboards. And they can click, hover, and delve deeper into datasets to find insights. As they can drill down into specific indicators, such as sales for a given location.- Use modifiable filters to examine performance patterns over various intervals.
- In static data presentations, draw attention to outliers that were overlooked.
Real-time insights
Interactive dashboards provide well-informed decision-making with real-time data. Businesses may maintain a competitive edge in fast-paced contexts by acting proactively. Among the examples are:- Marketing teams monitor the effectiveness of campaigns and make real-time adjustments.
- Sales managers can keep an eye on pipeline activities and quickly reallocate resources.
- Operations personnel react quickly to changes in inventory or interruptions in the supply chain.
Simplified data interpretation
Because interactive dashboards do not require technical knowledge, they democratize data. Everyone can access data via drag-and-drop filters and interactive visualizations. Because it lowers the IT department's dependability to generate reports. And promote the use of cross-functional team collaboration. So, to facilitate decision-making at all organizational levels more quickly.Customized firm solutions
Instagram professional dashboards are more relevant and useful when they can be customized to meet the needs of individual users. CEOs have access to high-level summaries of firm performance. And the managers are delving into specific data related to the KPIs of their team. Plus, for in-depth research, analysts employ sophisticated visualizations.Must-have features of an effective interactive dashboard
Let's look at the features you must include in your dashboard.Seamless data integration
To establish a single source of truth, connect several data sources. To establish connections and guarantee uniformity among CRM platforms, use semantic layers. If a retail dashboard integrates ERP and CRM data provides a comprehensive picture of inventory levels.Customized data visualizations
Adapt visual components to the brand's identity and user preferences. Among these are customized data possibilities for in-depth investigation. So, data visualization dashboards can employ bar graphs to compare expenses and line charts to show patterns in revenue.AI-powered analytics
Use AI to uncover more profound insights. You can use models for predictive forecasting. Even it helps in anomaly detection which is automated to identify odd trends. Moreover, a production dashboard might suggest preventive maintenance plans and forecast downtime.How to create the best interactive dashboards?
Here is the complete step-by-step guide to customize the dashboard.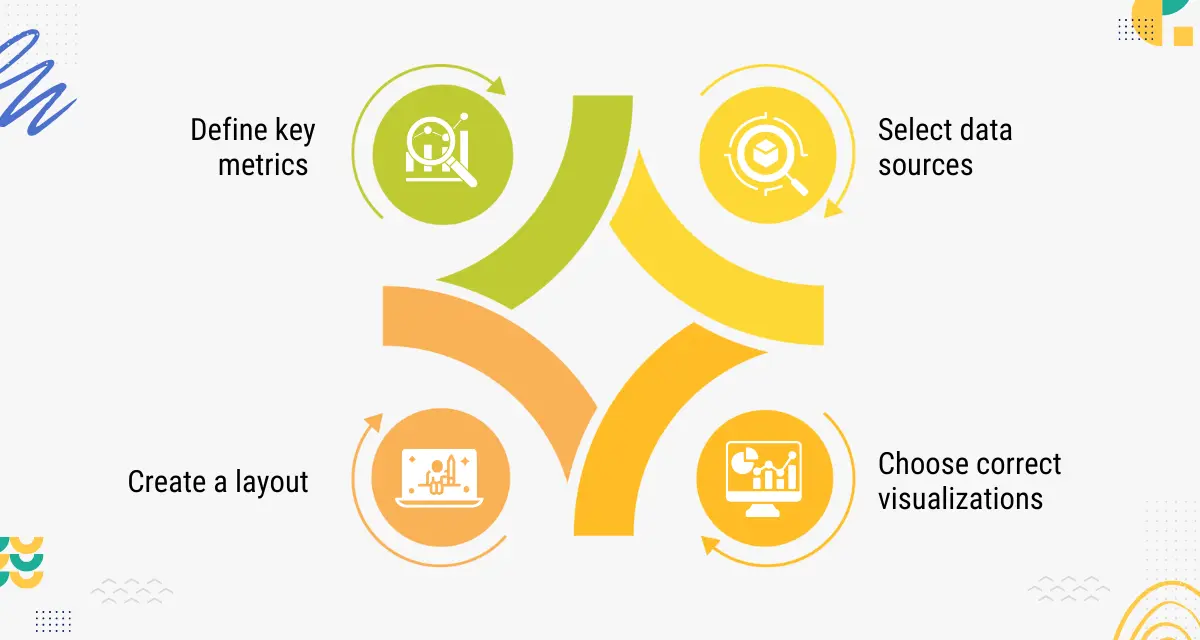
Define key metrics
Consider the precise metrics that are important to your users and their engagement. Pay attention to measures that can motivate activity and decision-making. Users should be able to dive down into conversion rates by region representative. Ensure the dashboard points consumers in the direction of insights to act upon. Ask yourself:- What particular steps will users take in response?
- Which important metrics should users be able to engage with?
Select data sources
Regular updates and data integration are essential for real-time interactive dashboards. Pay attention to how your dashboard will draw in real-time to guarantee optimal performance. So, you must think about data sources and how often the data gets refreshed. Ensure users can modify time frames to view historical & current performance. And it can support real-time queries for a truly dynamic experience.Create a layout
The structure of an interactive dashboard must do more than just look attractive. Put the metrics that users will interact with the most at the top of the priority list. Assemble linked metrics and make it simple for users for further in-depth visualizations. Ensure that drill-downs and filters are touch-friendly by designing with mobile.Choose correct visualizations
Effective visualizations encourage users to examine data to display in interactive dashboards. You can take advantage of heatmaps so that consumers can quickly view details. So, to allow viewers to access more detailed data in bar or line charts. Moreover, get the advantage of interactive sliders to change factors. Even users actively influence how they understand and analyze the data.Build vs. Buy: Which is the best approach for your business?
Here is the basic difference between the two interactive dashboards.Custom dashboard
Maximum flexibility and integration are possible when a dashboard is built from the ground up. Important advantages include:- Tailored solutions: Completely made to fit particular company requirements with particular KPIs.
- Increased flexibility: As business needs change, dashboards may adapt to accommodate smooth feature additions.
- Deeper integration: Unmatched access to internal data can be obtained through a custom-built solution's close integration.
- High resource needs
- Complex maintenance
- Long development
Pre-built dashboard
Pre-built dashboards are a quicker and easier solution. Some of the benefits are:- Rapid deployment: Time-to-insight can be accelerated by integrating ready-to-use technologies in days.
- Reduced barriers: Because pre-built technologies frequently have intuitive user interfaces
- Ongoing support: Vendors lower maintenance costs by offering frequent updates and technical assistance.
- Economical loopholes
- Limited customization
- Vendor dependency
Conclusion:
The strategic use of an interactive dashboard makes it an asset for businesses. Because the data-driven decisions it offers for forecasts and predictions are immense. If you want to create dashboards from the start or modify the existing consult a Dashboard Development Company for help.FAQs
What is an interactive dashboard used for? Key company indicators can be tracked, analyzed, monitored, and displayed by users through an interactive dashboard, a business data management tool. What distinguishes interactive dashboards from conventional dashboards? In contrast to static business reporting dashboards, an interactive dashboard lets you filter and drill down on operational data to see a measure in greater detail or from a new angle. What advantages can interactive dashboards offer? Real-time collaboration is made possible by interactive dashboards, which promote a quicker feedback loop and a deeper comprehension of the data. Users can examine certain charts, post comments, and obtain detailed insights with shared access, enabling your team or organization to make well-informed decisions. What is the price of creating a dashboard? Building a business dashboard app typically costs $37,500. Nonetheless, the whole expense may range from as low as $25,000 to as high as $50,000. The cost of a company dashboard app will be lower for one with fewer features than one with all the features planned. What are the primary obstacles encountered when creating analytics dashboards? One of the biggest obstacles when creating a dashboard is customization. Analytics dashboards are used by many departments to monitor metrics according to their own goals.